
In today’s digital age, maintaining a strong and secure communications infrastructure is critical for businesses of all sizes. As networks become more complex, traditional monitoring mechanisms often fail, leading to potential vulnerabilities and inefficiencies. Enter AI-powered network monitoring tools—cutting-edge solutions designed to revolutionize how we manage and protect our networks.
These advanced tools use machine learning and artificial intelligence to gain real-time insights, find anomalies, and predict potential problems, proactively automating routine tasks. AI tools for network monitoring provide in-depth analytics, ideally increasing operational efficiency and reliability. Adopting this technology means staying ahead of the curve in network management, ensuring robust connections, and safeguarding critical data in our increasingly interconnected world.
How do I choose the best network monitoring tool?
To choose the best AI tools for network monitoring, first assess your network size and key feature needs, such as real-time monitoring and integration capabilities. Ensure the tool offers reliable performance with real-time alerts and detailed reporting. Opt for a user-friendly interface that allows customization and can scale with your network. Verify compatibility with existing systems and robust support options. Consider total costs and potential ROI. Utilize free trials and check references from similar organizations to make an informed decision.
Understand Your Needs:
- Network Size: Match the tool’s capabilities with your network’s scale.
- Key Features: Prioritize features like real-time monitoring, anomaly detection, and integration with existing systems.
Performance and Reliability:
- Real-Time Monitoring: Ensure it provides real-time alerts for quick issue resolution.
- Reporting: Look for detailed reporting and historical data analysis.
Ease of Use:
- User Interface: Choose a tool with an intuitive interface.
- Customization: Check if it allows customization for your specific needs.
Scalability and Flexibility:
- Growth: Ensure the tool can scale with your network.
- Adaptability: It should support a wide range of devices and protocols.
Integration:
- Compatibility: Make sure it integrates with your current systems.
- APIs: Tools with robust APIs allow better customization.
Support and Community:
- Customer Support: Evaluate the vendor’s support quality and availability.
- Community Resources: A strong user community can be a valuable resource.
Cost and Value:
- Budget: Consider the total cost, including licensing and maintenance.
- ROI: Assess how the tool improves efficiency and reduces downtime.
Try Before You Buy:
- Free Trials: Use free trials to test the tool in your environment.
- References: Look for reviews or case studies from similar organizations.
Best 10 AI Tools for Network Monitoring
1. Nagios
Nagios is a powerful open network management tool that provides efficient management of systems, applications, applications, and business processes. It provides real-time alerting and analysis capabilities for overall network performance, availability, and health. Nagios supports thousands of plugins, making it highly customizable to different environments and needs. Its web-based interface provides detailed reports and graphs, helping operators quickly identify and resolve issues. Nagios also has a large and active community, which contributes to its extensive documentation and plugin library, ensuring that users receive ongoing support and development
How does Nagios work? –
1. Download the Nagios Core package from the official website.
2. Install required dependencies, including Apache, PHP, and GCC.
3. Extract and configure the Nagios Core package.
4. Install and configure the Nagios plugins.
5. Set up web access by configuring Apache for Nagios.
6. Start the Nagios service and set it to start on boot.
7. Access the Nagios web interface and log in using the default credentials.
8. Add hosts and services to be monitored by editing the configuration files.
Price –
| Plan | price |
|---|---|
| Enterprise | 100 Node $4,490 |
| Mid-Scale | 2-Instance $5,995 |
| Network Analyzer License | $2,995 |
| Fusion License | $2,995 |
2. SolarWinds Network Performance Monitor (NPM)
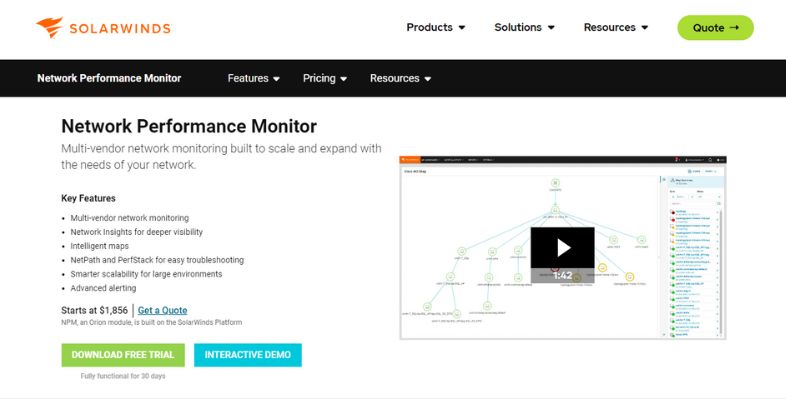
SolarWinds NPM is a highly regarded network management solution that provides real-time insights into network performance. It offers advanced features such as network access analysis, smart alerts, and advanced web graphics tools. NPM’s easy-to-use interface allows for rapid deployment and detailed performance specifications, helping administrators easily monitor network health. It supports multi-vendor network monitoring, ensuring compatibility with hardware and software systems. Additionally, SolarWinds NPM delivers robust reporting capabilities, facilitating the analysis of historical data to identify trends and prevent future issues.
How do I use SolarWinds Network Performance Monitor (NPM)? –
1. Download the SolarWinds NPM installer from the official website.
2. Run the installer and follow the prompts to complete the installation.
3. Launch the Orion Web Console and log in.
4. Use the Network Sonar Wizard to discover devices in your network.
5. Configure monitoring settings for discovered devices.
6. Set up alerts and notifications to monitor network performance.
7. Customize dashboards and views to visualize network data.
8. Regularly review performance metrics and reports to ensure network health.
Price –
| Plans | Price |
|---|---|
| Subscription | $1856 |
| Perpetual | $3592 |
3. PRTG Network Monitor
PRTG Network Monitor by Paessler is a comprehensive network monitoring solution that simplifies network management through its user-friendly interface and advanced features It uses a combination of SNMP, packet sniffing, and flow monitoring to provide real-time insights into network performance . PRTG offers a flexible alert system that notifies employees of issues via email, SMS, or push notifications. Its customizable dashboards and extensive reporting features help visualize network health and performance data. PRTG is scalable, making it suitable for all sizes of websites, from small businesses to large enterprises.
How do I start monitoring with PRTG? –
1. Download and install the PRTG Network Monitor from the Paessler website.
2. Launch the PRTG web interface and complete the initial configuration.
3. Use the auto-discovery feature to detect network devices.
4. Create sensors to monitor specific aspects of the network, such as bandwidth and uptime.
5. Set up notifications to receive alerts about network issues.
6. Customize the dashboard to display relevant network information.
7. Analyze historical data using the reporting feature to identify trends.
8. Scale the system by adding additional probes if needed.
Price –
Free
4. Zabbix
Zabbix is an open-source web monitoring tool known for its high performance and scalability. It provides efficient management of networks, servers, cloud services and applications. Zabbix supports multiple monitoring systems and offers advanced features such as predictive monitoring, root cause analysis, and trend analysis Its intuitive alerting system ensures that employees are notified for problems quickly. Zabbix’s web-based interface provides detailed dashboards and views, which help to quickly identify and resolve issues. Additionally, Zabbix has a robust community support system, which supports continuous improvement and feature expansion.
How do I install Zabbix? –
1. Download and install the Zabbix server package from the official website.
2. Install and configure a database (MySQL, PostgreSQL, etc.) for Zabbix.
3. Set up the Zabbix front end by configuring Apache and PHP.
4. Start the Zabbix server and frontend services.
5. Log in to the Zabbix web interface using the default credentials.
6. Add hosts and configure items, triggers, and actions for monitoring.
7. Set up user roles and permissions as needed.
8. Customize dashboards and screens to display monitoring data.
Price –
$2,400 per year
5. ManageEngine OpManager
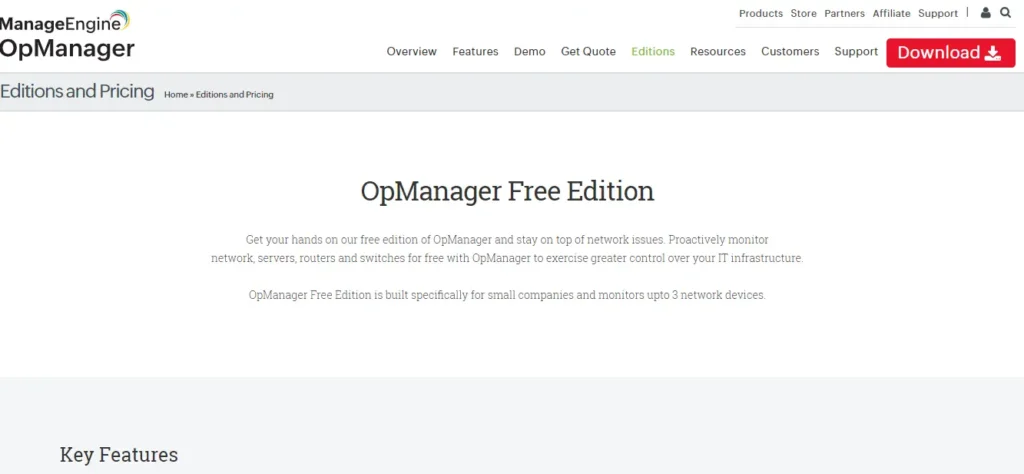
ManageEngine OpManager is a versatile network management tool that provides real-time monitoring of network devices, servers, and applications. It offers advanced features such as automatic web discovery, advanced web mapping and smart alerts. OpManager’s intuitive interface allows for easy configuration and management, while its advanced reporting tools help analyze network performance and identify issues The tool also supports network protocols and enables customizable dashboards and widgets see well. The flexibility of OpManager makes it suitable for both small and large projects, ensuring efficient network management and optimal performance.
A Guide to Quick-start ManageEngine OpManager –
1. Download the OpManager installer from the ManageEngine website.
2. Run the installer and follow the instructions to complete the installation.
3. Launch the OpManager web console and log in.
4. Use the discovery wizard to detect network devices.
5. Configure monitoring settings for the discovered devices.
6. Set up alerts and notification profiles to monitor network performance.
7. Customize the dashboards and views to visualize network data.
8. Regularly check performance metrics and generate reports for analysis.
Price –
$245 for 10 devices
Aslo read – Best AI Tools for IT Professionals
6. WhatsUp Gold

WhatsUp Gold by Progress is a comprehensive network monitoring solution that provides real-time visibility into the status and performance of network devices and applications. It has advanced detection, mapping, and alerting capabilities to help operators identify and resolve network issues faster. WhatsUp Gold supports various monitoring protocols and provides detailed performance metrics and reports. Its user-friendly interface allows for easy customization of dashboards and views, making it easier to maintain the web. In addition, WhatsUp Gold offers additional integration and IT management tools, increasing its functionality and functionality.
How does WhatsUp Gold work? –
1. Download the WhatsUp Gold installer from the Progress website.
2. Run the installer and complete the installation process.
3. Launch the WhatsUp Gold web interface and log in.
4. Use the Discovery Wizard to scan and detect network devices.
5. Configure monitoring settings for the discovered devices.
6. Set up alert notifications to receive updates on network status.
7. Customize the dashboard to display network performance data.
8. Use the reporting features to analyze network trends and health.
Price –
$2,740 for 25 devices
7. Datadog
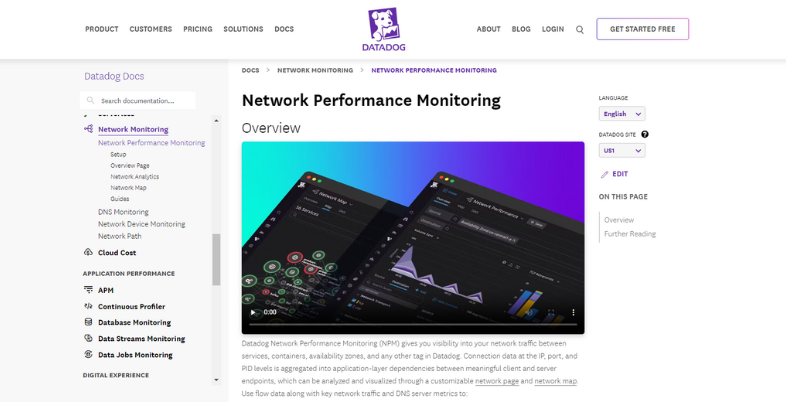
Datadog is a cloud-based monitoring and analytics platform that enables efficient management of network infrastructure, applications and services. It provides real-time analysis, alerting, and visualization tools to help operators quickly identify and resolve issues. Datadog supports a wide range of integrations with other tools and services, making it versatile. Its advanced analytical capabilities allow for in-depth analysis of business metrics and trends. Customizable Datadog dashboards and extensive reporting features provide valuable insights into network health and performance, aiding in agile deployment and optimization
How do I start navigating Datadog? –
1. Sign up for a Datadog account on the official website.
2. Install the Datadog Agent on your servers and network devices.
3. Configure the Datadog Agent by editing the configuration files.
4. Log in to the Datadog web interface.
5. Use integrations to connect Datadog with other services and tools.
6. Set up dashboards to visualize network performance data.
7. Create monitors and set up alerting rules to receive notifications.
8. Analyze performance metrics and generate reports for insights.
Price –
| Plan | price |
|---|---|
| Pro | $15 |
| Enterprise | $23 |
Suggested Read – Best AI Data Analytics Tools
8. LogicMonitor
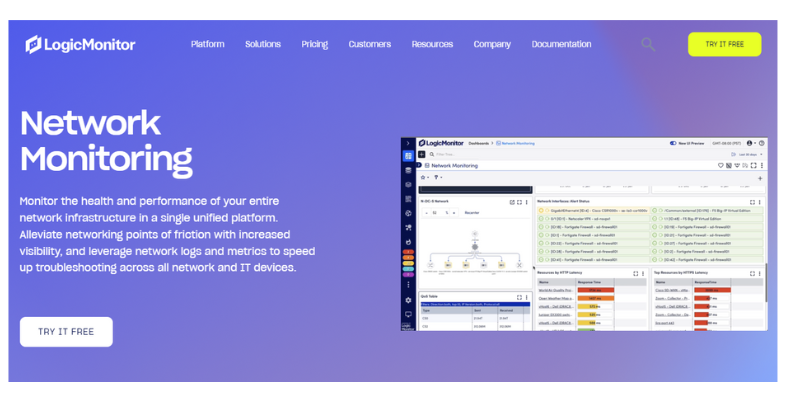
LogicMonitor is a cloud-based network monitoring solution that provides automatic monitoring on network devices, servers, and applications. It offers advanced features such as anomaly detection, predictive analytics and intelligent alerts. LogicMonitor’s easy-to-use interface and automatic discovery and configuration capabilities simplify planning and configuration. Its extensive dashboards and reporting tools provide a real-time overview of network performance, helping operators quickly identify and resolve issues. LogicMonitor’s scalability and comprehensive integration support make it suitable for organizations of all sizes, ensuring efficient network management.
How does logicmonitor work? –
1. Sign up for a LogicMonitor account.
2. Install the LogicMonitor Collector on a system within your network.
3. Configure the Collector by providing necessary credentials and settings.
4. Log in to the LogicMonitor web interface.
5. Add devices and configure monitoring settings for each device.
6. Set up alert rules to receive notifications about network issues.
7. Customize dashboards to display relevant network information.
8. Use the reporting tools to analyze performance trends and data.
Price –
| Plans | Price |
|---|---|
| Basic | $20/mo |
9. Icinga
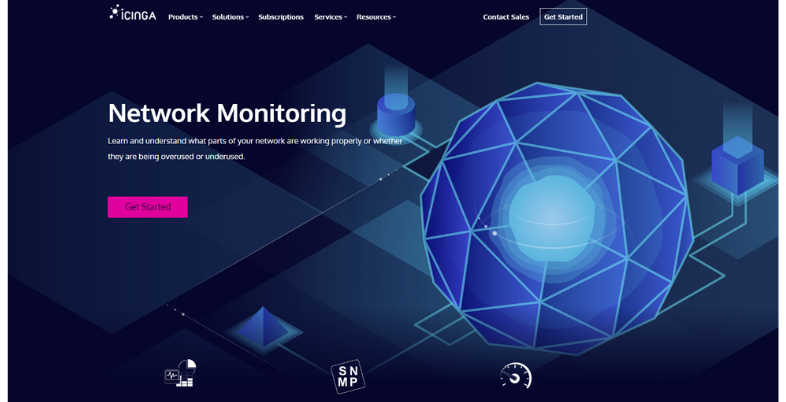
Icinga is an open network monitoring tool that provides real-time monitoring and alerting for network devices, servers, and applications. It offers advanced features such as business data visualization, automatic discovery and flexible alerts. Icinga’s web-based interface allows easy editing of dashboards and views, facilitating good web management. It supports various monitoring protocols and integrates with other IT management tools to improve its functionality. Icinga’s strong community support and extensive documentation ensure continuous improvement and expansion of features, making it a reliable choice for network design
How do I use Icinga? –
1. Download and install Icinga from the official website.
2. Set up a database (MySQL, PostgreSQL, etc.) for Icinga.
3. Install and configure the Icinga Web interface.
4. Start the Icinga service and ensure it runs at boot.
5. Log in to the Icinga web interface using default credentials.
6. Add hosts and services to be monitored by editing configuration files.
7. Set up notifications to alert administrators of issues.
8. Customize dashboards and views to display monitoring data.
Price –
Free
10. Spiceworks Network Monitor
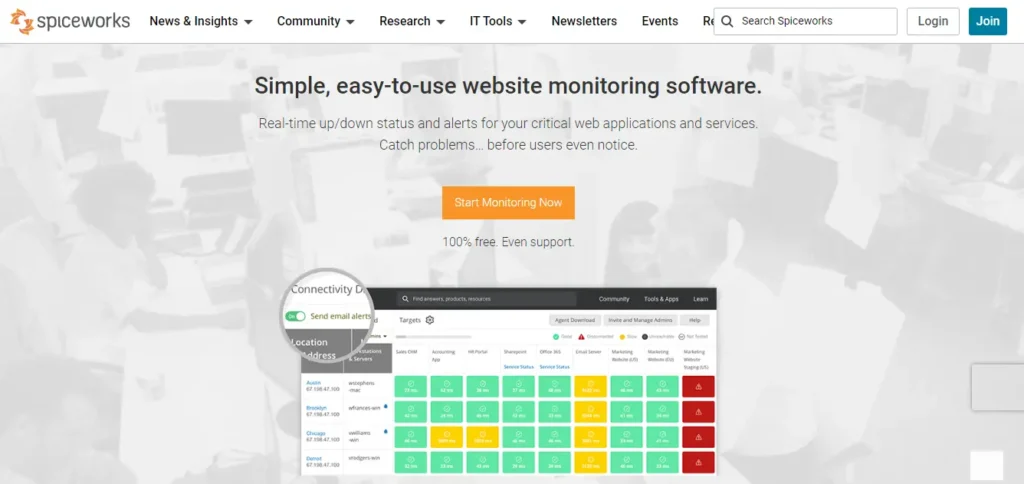
Spiceworks Network Monitor is a free network monitoring tool that provides real-time insights into network performance and availability. It offers features such as automatic device recognition, customizable alerts, and detailed performance descriptions. Spiceworks’ user-friendly interface allows for easy configuration and monitoring, while its customizable dashboards and reports help visualize network health. The tool supports network protocols and provides integration with other IT management solutions. Spiceworks’ active community and extensive documentation ensure continued support and growth, making it a valuable tool for small and medium-sized businesses.
How do I set up Spiceworks connectivity dashboard? –
1. Download and install Spiceworks Network Monitor from the official website.
2. Launch the application and complete the initial configuration.
3. Use the network scan feature to discover devices.
4. Configure monitoring settings for the discovered devices.
5. Set up alert notifications to monitor network performance.
6. Customize the dashboard to display network status and performance metrics.
7. Regularly review reports and logs to ensure network health.
8. Integrate with other IT management tools as needed for enhanced functionality.
Price –
Free
CONCLUSION
In conclusion, AI-powered network monitoring tools are changing the landscape of IT infrastructure management. Leveraging the power of machine learning and artificial intelligence, these tools provide unparalleled real-time analysis, anomaly detection and predictive analytics This not only increases network performance but improves security and operational efficiency is more effective. As companies rely on complex networks, adopting AI tools will be essential to maintaining a competitive edge.
They enable quick resolution, reduce downtime, and ensure a seamless flow of data. Investing in the best AI tools for managing networks is a strategic strategy that empowers organizations to be flexible, productive and secure in an ever-evolving digital environment Leverage these advanced technologies acknowledge this to enable future proofing of their communication to ensure continued business success. For further insights into AI-powered network management tools click here
FAQ’S
1. What is AI monitoring?
AI monitoring uses artificial intelligence to analyze and manage systems in real-time, detecting anomalies, predicting issues, and automating responses to enhance efficiency and security. It transforms traditional monitoring by providing intelligent, proactive oversight.
2. Can AI network monitoring be implemented in live production networks?
Yes, AI network monitoring can be implemented in live production networks to enhance real-time analysis and threat detection. This integration improves network performance and security by leveraging AI’s capabilities for rapid data processing and anomaly identification.
3. How can AI network monitoring tools be integrated with additional management and security services?
AI network monitoring tools can integrate with management and security services through API configuration and data alignment, optimizing network oversight and cybersecurity.
4. examples of AI applications in network monitoring?
AI applications in network monitoring include anomaly detection for identifying unusual network behavior and predictive maintenance to preemptively address potential issues, enhancing overall network reliability and security.